Waveform Measurements in Oscilloscope
You use many terms to describe the types of measurements that you take with your oscilloscope. This section describes some of the most common measurements and terms.
Frequency and Period
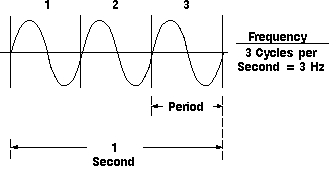
If a signal repeats, it has a frequency. The frequency is measured in Hertz (Hz) and equals the number of times the signal repeats itself in one second (the cycles per second). A repeating signal also has a period - this is the amount of time it takes the signal to complete one cycle. Period and frequency are reciprocals of each other, so that 1/period equals the frequency and 1/frequency equals the period. So, for example, the sine wave in following figure has a frequency of 3 Hz and a period of 1/3 second.

Frequency and Period
Voltage
Voltage is the amount of electric potential (a kind of signal strength) between two points in a circuit. Usually one of these points is ground (zero volts) but not always - you may want to measure the voltage from the maximum peak to the minimum peak of a waveform, referred to at the peak-to-peak voltage. The word amplitude commonly refers to the maximum voltage of a signal measured from ground or zero volts. The waveform shown in Figure 8 has an amplitude of one volt and a peak-to-peak voltage of two volts.
Phase
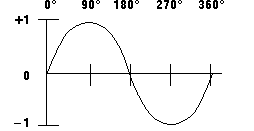
Phase is best explained by looking at a sine wave. Sine waves are based on circular motion and a circle has 360 degrees. One cycle of a sine wave has 360 degrees, as shown in following figure. Using degrees, you can refer to the phase angle of a sine wave when you want to describe how much of the period has elapsed.

Sine Wave Degrees
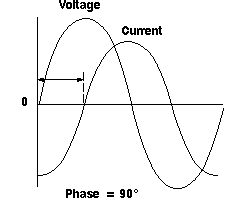
Phase shift describes the difference in timing between two otherwise similar signals. In following figure, the waveform labeled "current" is said to be 905 out of phase with the waveform labeled "voltage," since the waves reach similar points in their cycles exactly 1/4 of a cycle apart (360 degrees/4 = 90 degrees). Phase shifts are common in electronics.

Phase Shift Diagram |